Updated November 2026 | Authored by Scott Engle, Broker DRE #01332676 | Realty Management Group | Serving San Diego County Since 2005
Last verified against primary sources: November 2, 2026.
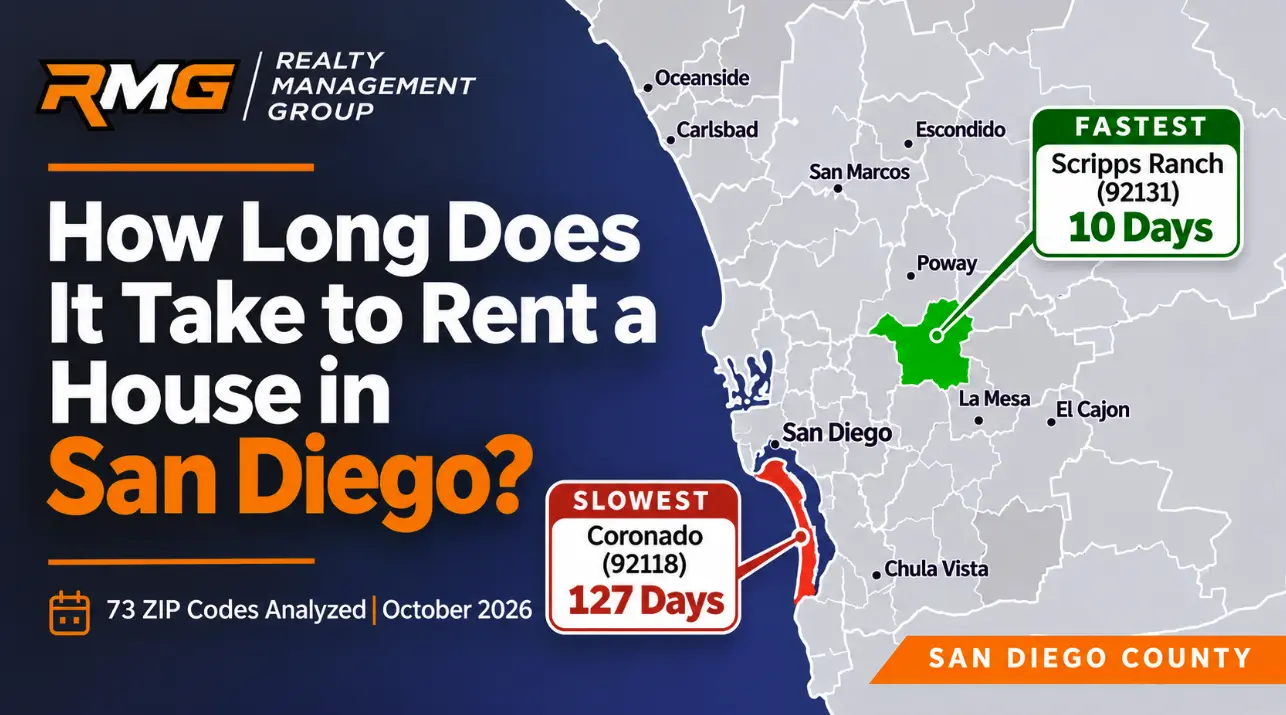
A house listed for rent in San Diego County had been on the market 31 days on average, in RentCast data retrieved October 27, 2026, across the 73 ZIP codes with ten or more single-family listings. The spread is the useful part: 10 days in Scripps Ranch (92131) and 127 in Coronado (92118), with 20 ZIP codes at 20 days or under and 3 over 60.
The figure is a listing-age measure, which this page defines before it uses: how long the houses listed in a ZIP had been on the market when RentCast measured them. It is not the average time it takes to find a tenant; no source in this dataset measures that countywide, and this page does not claim one. RMG's own completed leases averaged 13 days from vacancy to signed lease, a different clock, defined below.
This page ranks every published ZIP by the average age of its house listings, breaks the county figure out by bedroom count and property type, explains what RentCast's number measures and what RMG's 13-day figure measures, and ends with what to do when a listing passes its ZIP's average. Rents for the same ZIP codes are in average rent in San Diego by ZIP code; the pricing method is in how to price a rental in San Diego.
The short answers
How long does it take to rent a house in San Diego? There is no verified countywide average from listing to signed lease in this dataset. The closest market indicator is average listing age: 31 days across 73 ZIP codes with ten or more house listings as of October 27, 2026, each ZIP counted once (32 weighted by listings), with half the ZIP codes at 30 days or under. RMG's own completed leases averaged 13 days from vacancy to signed lease, countywide, on a different clock.
Which ZIP codes have the shortest listing age for houses? Scripps Ranch (92131, 10 days), San Marcos (92069, 11 days), Tierrasanta (92124, 12 days), Del Cerro, Allied Gardens (92120, 13 days), La Mesa (91942, 14 days).
Which have the longest? Coronado (92118, 127 days), Del Mar (92014, 64 days), Chula Vista (91914, 63 days), Bonita (91902, 53 days), Point Loma (92106, 52 days).
Does bedroom count matter? Less than ZIP does. Weighted by listings, one-bedrooms averaged 37 days, two-bedrooms 31, three-bedrooms 32, four-bedrooms 32, across all property types.
How long does RMG take? Vacant RMG-managed homes leased in 13 days on average, measured from vacancy date to signed lease date across more than 40 leases in the trailing 24 months ending August 2026, countywide. That clock starts earlier than a listing does, so the two figures are not directly comparable.
| Measure | Figure | Basis |
|---|---|---|
| Houses, average of ZIP averages | 31 days | 73 ZIP codes with 10+ single-family listings, each counted once |
| Houses, weighted by listings | 32 days | 3,221 single-family listings |
| Shortest average listing age, houses | 10 days, Scripps Ranch (92131) | 20 house listings |
| Longest average listing age, houses | 127 days, Coronado (92118) | 104 house listings |
| ZIP codes at 20 days or under | 20 of 73 | houses |
| All property types, weighted | 33 days apartments, 37 condos, 32 houses | listing-weighted across published ZIPs |
| Countywide average asking rent | $3,363 | listing-weighted, 15,963 listings, 77 ZIP codes; RMG calculation |
| RMG days to lease | 13 days, vacancy to signed lease | 40+ leases, 24 months to Aug 2026, countywide; different clock |
Source: RentCast market statistics per ZIP, retrieved October 27, 2026 through Realty Management Group's API account. Days on market is RentCast's average days on the market of listed properties, a listing-age measure that includes listings still active. RMG figure: internal Rentvine data, method stated below.
San Diego rental owners
Will your home sit for 10 Days, or 60 Days?
Across 73 San Diego County ZIP codes, house listings averaged 31 days on market, from 10 in Scripps Ranch to 127 in Coronado. A licensed broker prices your property against this month's listings in your ZIP and bedroom count, and tells you the number.
See What My Property Could Rent For →Free. Broker-reviewed. No obligation. Or call (619) 456-0000.
What this guide covers
- What days on market measures, and what it does not
- Days on market for houses in 73 ZIP codes, shortest to longest
- The ten shortest and ten longest listing ages
- Days on market by bedroom count
- Houses, condos, townhouses and apartments
- What RMG's 13 days measures
- When your listing passes the ZIP average
- Methodology
- Frequently asked questions
- Sources
What Days on Market Measures, and What It Does Not
RentCast's documentation defines the field as the average days on the market of listed properties. Three things follow. The clock starts when a listing goes live, not when the prior tenant moved out, so make-ready time before listing is not counted.
The figure includes listings that are still active as well as ones that have come down, so it is the age of the listing pool, not the time to a signed lease. And a listing that comes down may have leased, been withdrawn, or been relisted at a new price; the figure does not say which.
One more caution. RentCast's median days on market collapses to two or three days in a third of the county's ZIP codes, because a share of listings come down within a day or two of posting. This page uses the average throughout and never the median.
Days on Market for Houses in 73 San Diego County ZIP Codes, Shortest to Longest
Every ZIP code in the county with ten or more single-family listings on October 27, 2026, ranked by the average days its house listings had been on the market, shortest listing age first. House average rent is the single-family average for the ZIP; all-type days is the figure across every property type.
| ZIP | Area | House days on market | House listings | House avg rent | All-type days |
|---|---|---|---|---|---|
| 92131 | Scripps Ranch | 10 | 20 | $4,712 | 13 |
| 92069 | San Marcos | 11 | 17 | $4,075 | 43 |
| 92124 | Tierrasanta | 12 | 15 | $4,478 | 11 |
| 92120 | Del Cerro, Allied Gardens | 13 | 32 | $5,151 | 13 |
| 91942 | La Mesa | 14 | 33 | $3,364 | 31 |
| 92116 | Normal Heights, Kensington | 15 | 61 | $3,563 | 50 |
| 92122 | University City | 15 | 41 | $4,204 | 17 |
| 92103 | Hillcrest, Mission Hills | 16 | 42 | $3,796 | 35 |
| 92040 | Lakeside | 16 | 25 | $3,119 | 62 |
| 92026 | Escondido | 17 | 26 | $3,865 | 24 |
| 92115 | College Area, Rolando | 17 | 332 | $5,893 | 28 |
| 92130 | Carmel Valley | 17 | 55 | $5,387 | 13 |
| 92105 | City Heights | 17 | 44 | $2,711 | 67 |
| 92007 | Cardiff | 18 | 13 | $6,098 | 19 |
| 92111 | Linda Vista, Clairemont Mesa East | 18 | 52 | $3,788 | 43 |
| 91945 | Lemon Grove | 18 | 27 | $3,461 | 37 |
| 92020 | El Cajon | 19 | 37 | $3,500 | 64 |
| 92011 | Carlsbad | 19 | 26 | $5,635 | 14 |
| 92126 | Mira Mesa | 20 | 58 | $3,929 | 20 |
| 91950 | National City | 20 | 43 | $2,465 | 62 |
| 92010 | Carlsbad | 21 | 18 | $5,034 | 16 |
| 91941 | La Mesa | 22 | 29 | $4,060 | 41 |
| 92071 | Santee | 22 | 42 | $3,763 | 28 |
| 92128 | Rancho Bernardo | 22 | 46 | $4,236 | 14 |
| 92029 | Escondido | 22 | 24 | $5,120 | 23 |
| 92064 | Poway | 22 | 34 | $4,956 | 48 |
| 92119 | San Carlos | 22 | 14 | $3,981 | 12 |
| 91913 | Chula Vista, Eastlake | 23 | 47 | $4,032 | 15 |
| 92104 | North Park | 23 | 61 | $3,251 | 47 |
| 92127 | Rancho Bernardo West, 4S Ranch | 24 | 33 | $5,719 | 13 |
| 92081 | Vista | 25 | 29 | $4,226 | 21 |
| 92102 | Golden Hill, Sherman Heights | 25 | 48 | $2,789 | 60 |
| 92021 | El Cajon | 27 | 34 | $3,337 | 61 |
| 92025 | Escondido | 28 | 35 | $3,790 | 42 |
| 92024 | Encinitas | 29 | 56 | $5,848 | 57 |
| 91910 | Chula Vista | 29 | 65 | $3,216 | 41 |
| 91911 | Chula Vista | 30 | 48 | $3,591 | 34 |
| 92027 | Escondido | 30 | 31 | $3,980 | 29 |
| 92117 | Clairemont | 30 | 61 | $4,021 | 27 |
| 92154 | Otay Mesa, Nestor | 30 | 53 | $3,755 | 20 |
| 92083 | Vista | 31 | 21 | $3,481 | 21 |
| 92008 | Carlsbad | 31 | 38 | $4,947 | 43 |
| 92057 | Oceanside | 31 | 78 | $3,821 | 29 |
| 92107 | Ocean Beach | 32 | 39 | $5,105 | 47 |
| 92075 | Solana Beach | 32 | 27 | $6,557 | 44 |
| 92078 | San Marcos | 32 | 58 | $4,289 | 34 |
| 92056 | Oceanside | 33 | 72 | $3,904 | 41 |
| 92009 | Carlsbad | 33 | 57 | $5,516 | 38 |
| 92054 | Oceanside | 34 | 81 | $4,498 | 45 |
| 92065 | Ramona | 35 | 20 | $3,783 | 67 |
| 92110 | Bay Park, Morena | 35 | 24 | $3,927 | 44 |
| 92113 | Logan Heights, Barrio Logan | 35 | 25 | $2,687 | 58 |
| 91915 | Chula Vista, Otay Ranch | 35 | 34 | $3,919 | 18 |
| 92019 | El Cajon | 36 | 35 | $3,521 | 27 |
| 92139 | Paradise Hills, Bay Terraces | 37 | 26 | $3,526 | 47 |
| 92003 | Bonsall | 38 | 10 | $4,257 | 54 |
| 92109 | Pacific Beach, Mission Beach | 38 | 70 | $5,219 | 41 |
| 92129 | Rancho Penasquitos | 41 | 40 | $4,901 | 23 |
| 92114 | Encanto | 41 | 46 | $3,371 | 51 |
| 92058 | Oceanside | 42 | 24 | $3,951 | 39 |
| 92084 | Vista | 43 | 40 | $3,602 | 42 |
| 91977 | Spring Valley | 44 | 44 | $3,487 | 48 |
| 92123 | Serra Mesa, Kearny Mesa | 44 | 16 | $4,285 | 10 |
| 92028 | Fallbrook | 45 | 50 | $3,878 | 56 |
| 92108 | Mission Valley | 46 | 29 | $3,147 | 10 |
| 91932 | Imperial Beach | 47 | 89 | $3,865 | 60 |
| 92101 | Downtown | 48 | 61 | $3,465 | 21 |
| 92037 | La Jolla | 51 | 67 | $6,435 | 55 |
| 92106 | Point Loma | 52 | 25 | $5,593 | 36 |
| 91902 | Bonita | 53 | 12 | $4,791 | 28 |
| 91914 | Chula Vista | 63 | 13 | $5,633 | 55 |
| 92014 | Del Mar | 64 | 39 | $6,575 | 54 |
| 92118 | Coronado | 127 | 104 | $6,213 | 105 |
Source: RentCast property-type breakdown per ZIP, retrieved October 27, 2026. ZIP codes with fewer than ten house listings are not ranked: Sorrento Valley (92121, 6), San Ysidro (92173, 6), Alpine (91901, 9), Julian (92036, 9). Rents for every ZIP, by bedroom, are in the ZIP hub.
Bottom line: in 39 of 73 ZIP codes, house listings average 30 days or under on the market. If your listing is well past your ZIP's average, review pricing, condition, marketing and showing access before assuming the local market is the reason.
Flat-fee property management
From start to finish, RMG can help.
We price it, list it and manage it for a flat $199 a month at rents up to $5,000, with no leasing fee at turnover. RMG-managed homes averaged 13 days from vacancy to signed lease, countywide. First three months free.
Have RMG Lease My Property →$3,363 is the listing-weighted countywide average asking rent in Table 1. No renewal or maintenance-markup fees. Or call (619) 456-0000.
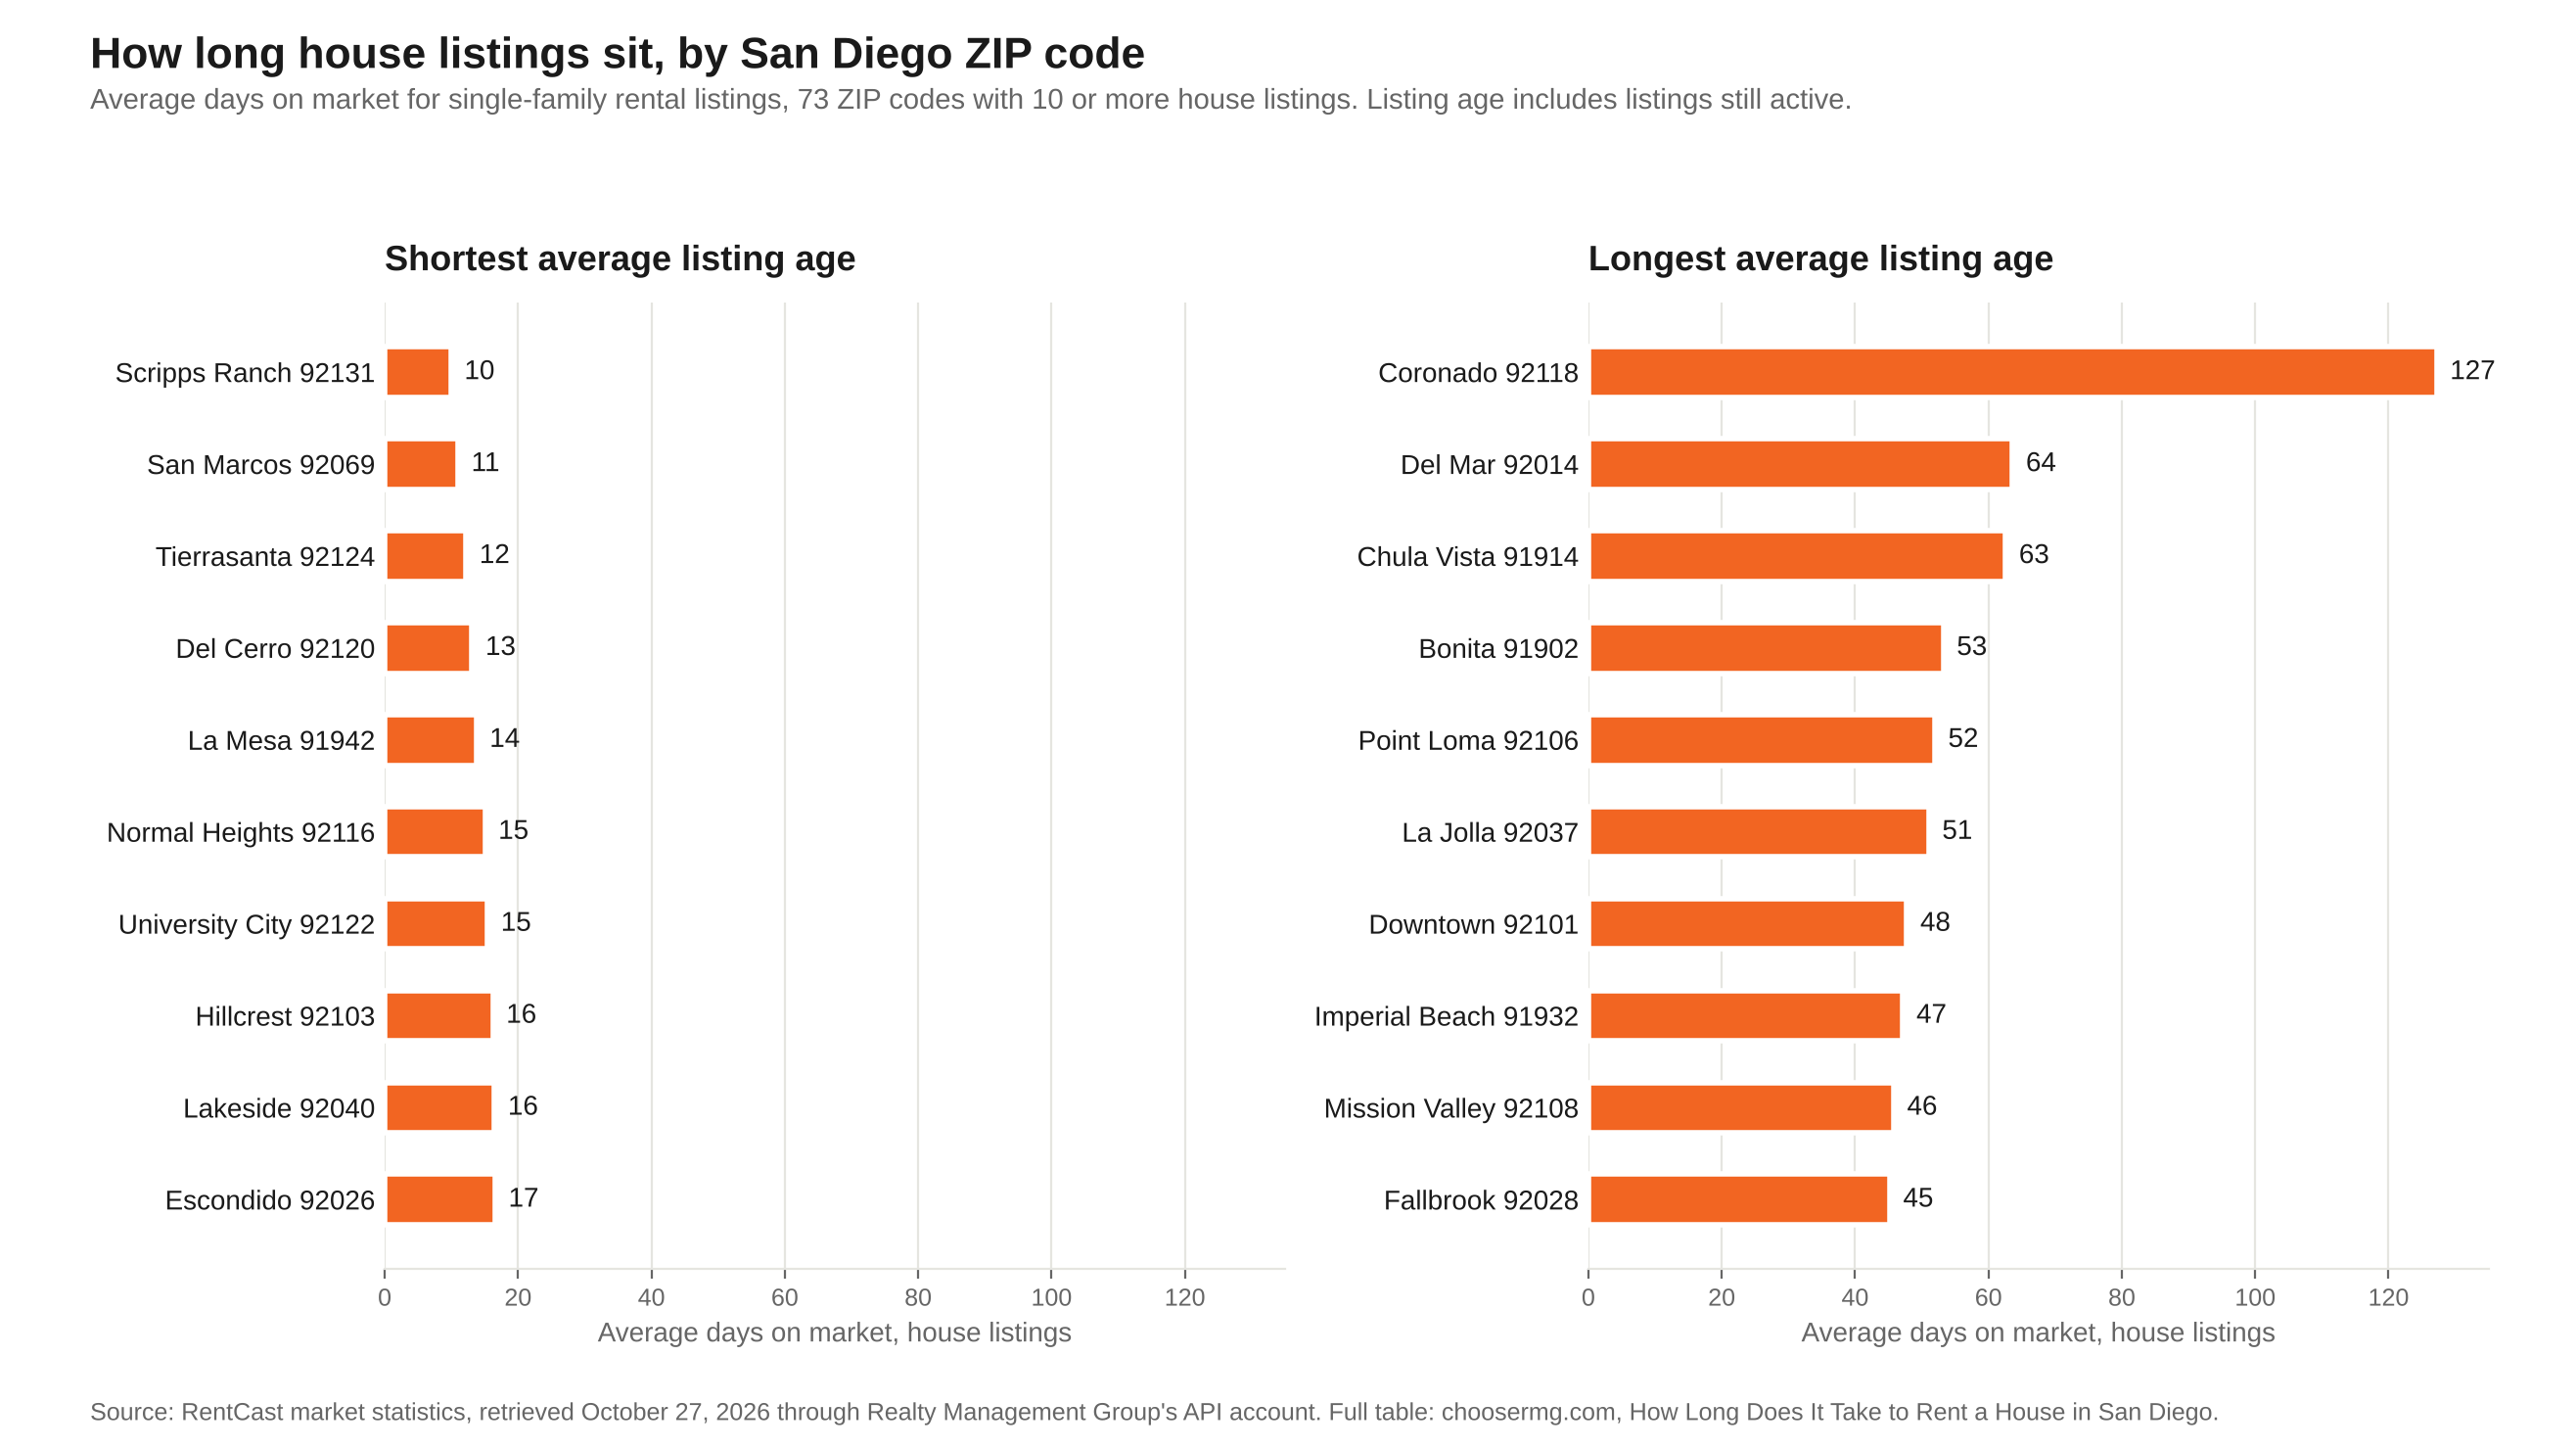
The Ten Shortest and Ten Longest Average Listing Ages for Houses, by San Diego ZIP Code
Shortest average listing age
- Scripps Ranch (92131): 10 days, 20 house listings, $4,712 average
- San Marcos (92069): 11 days, 17 house listings, $4,075 average
- Tierrasanta (92124): 12 days, 15 house listings, $4,478 average
- Del Cerro, Allied Gardens (92120): 13 days, 32 house listings, $5,151 average
- La Mesa (91942): 14 days, 33 house listings, $3,364 average
- Normal Heights, Kensington (92116): 15 days, 61 house listings, $3,563 average
- University City (92122): 15 days, 41 house listings, $4,204 average
- Hillcrest, Mission Hills (92103): 16 days, 42 house listings, $3,796 average
- Lakeside (92040): 16 days, 25 house listings, $3,119 average
- Escondido (92026): 17 days, 26 house listings, $3,865 average
Longest average listing age
- Coronado (92118): 127 days, 104 house listings, $6,213 average
- Del Mar (92014): 64 days, 39 house listings, $6,575 average
- Chula Vista (91914): 63 days, 13 house listings, $5,633 average
- Bonita (91902): 53 days, 12 house listings, $4,791 average
- Point Loma (92106): 52 days, 25 house listings, $5,593 average
- La Jolla (92037): 51 days, 67 house listings, $6,435 average
- Downtown (92101): 48 days, 61 house listings, $3,465 average
- Imperial Beach (91932): 47 days, 89 house listings, $3,865 average
- Mission Valley (92108): 46 days, 29 house listings, $3,147 average
- Fallbrook (92028): 45 days, 50 house listings, $3,878 average
The short-age list is inland and mid-priced: Scripps Ranch, San Marcos, Tierrasanta, Allied Gardens, La Mesa, Normal Heights, Kensington, University City. The long-age list is the coast and the high end: Coronado, Del Mar, Point Loma, La Jolla, plus the two thinnest samples on it, Chula Vista and Bonita, at 13 and 12 house listings.
The ten longest-age ZIP codes averaged $4,960 in house rent against $4,033 for the ten shortest. Across all 73 ZIP codes the relationship between house rent and listing age is positive but weak (correlation 0.29): dearer ZIP codes tend to carry older listings, and plenty do not.
Bottom line: Coronado is its own market: 104 house listings at $6,213, on the market 127 days on average, twice the next-longest ZIP. Treat it as the exception, not the end of a scale.
Days on Market by Bedroom Count, San Diego County, October 2026
| Bedrooms | Days on market | Listings behind the figure |
|---|---|---|
| 1-bedroom | 37 | 5,299 |
| 2-bedroom | 31 | 6,070 |
| 3-bedroom | 32 | 2,211 |
| 4-bedroom | 32 | 878 |
Source: RentCast bedroom breakdown per ZIP, retrieved October 27, 2026; each ZIP's bedroom figure weighted by its listing count. Studio and five-plus-bedroom categories are too thin in most ZIP codes to aggregate.
Bedroom count barely moves the county figure: two-, three- and four-bedrooms all sit near 31 days, one-bedrooms a little longer at 37. ZIP moves it far more. For three-bedroom listings alone, across 68 ZIP codes with ten or more of them, the shortest listing ages were in Mission Valley (8 days), University City (10 days), Del Cerro, Allied Gardens (11 days), Scripps Ranch (12 days) and the longest in Coronado (105), Ocean Beach (59), Ramona (58), Vista (58).
Bottom line: a three-bedroom in Mission Valley and a three-bedroom in Coronado are the same bedroom count and different markets. Price to the ZIP row.
Houses, Condos, Townhouses and Apartments: Which Listings Are Oldest
| Property type | Days on market | Listings behind the figure | ZIP codes |
|---|---|---|---|
| Single-family house | 32 | 3,251 | 77 |
| Townhouse | 32 | 600 | 50 |
| Apartment | 33 | 10,098 | 74 |
| Condo | 37 | 1,768 | 64 |
Source: RentCast property-type breakdown per ZIP, retrieved October 27, 2026. The house figure here rests on 3,251 listings across 77 ZIP codes because this table includes ZIP codes with five to nine house listings; Table 2 ranks only ZIP codes with ten or more, 3,221 listings across 73.
Countywide the four types land within five days of one another on the weighted figure. The difference shows up inside ZIP codes, where apartment and house listings often differ in age: in National City apartments had been listed 86 days on average against 20 for houses, in Lemon Grove 52 against 18, while in Eastlake 91913 apartment listings averaged 10 days and houses 23. The ZIP hub carries both figures for every ZIP.
What RMG's 13 Days Measures, and Why It Is a Different Clock
Vacant RMG-managed homes leased in 13 days on average across more than 40 leases signed in the trailing 24 months ending August 2026, measured from vacancy date to signed lease date, countywide, under the flat-fee management described on the pricing page. Occupancy reflects occupied managed units as a percentage of rentable managed units as of August 2026. On-time rent reflects payments received by the contractual due date across the trailing 24 months ending August 2026. Average tenancy is the mean across tenancies completed in the trailing 24 months ending August 2026. Internal Rentvine management data.
Put that beside the 31-day market figure carefully. RMG's clock starts the day the prior tenant leaves and stops at a signed lease, so it includes make-ready time and excludes nothing. RentCast's clock starts at listing, includes listings still sitting, and stops at removal for any reason.
The two are not a like-for-like comparison and this page does not present them as one. RMG's reading, not a measured comparison: a managed home that is priced to its ZIP row, photographed and shown promptly does not spend a month on the market in most of the county, and the ZIP table above shows which markets make that harder.
The national benchmarks owners usually see are two more clocks again. RentCafe's 2025 year-end figure of 41 days is total days vacant, including make-ready before listing, so it is closest in kind to RMG's measure; Apartment List's figure of about 30 days is list-to-lease and leaves make-ready out. Both describe national apartment inventory, not San Diego houses, and neither is the RentCast listing-age figure on this page. Four measures, four definitions; the page keeps them apart.
City-level RMG figures, with their unit counts, are on the city guides: La Mesa, National City, Lemon Grove and Spring Valley and Santee and Lakeside.
When Your Listing Passes the ZIP Average: What to Change First
Every vacant day costs monthly rent times twelve, divided by 365: about $111 a day at the $3,363 countywide average, and the vacancy calculator runs it for your rent.
A listing that passes its ZIP's house average with few showings and no applications has a problem the data on this page cannot name for you. Price is the usual one, not the only one. Work the list in order.
1. Price against the row. Compare the asking rent with the bedroom row for the ZIP and with the live listings, not the all-unit average. The pricing guide covers the method and the adjustments.
2. Showings. Few inquiries means price or photos; inquiries without showings means access, response time or scheduling; showings without applications means condition or something the photos hid.
3. Photos and listing text. Daylight, every room, the yard and the parking; bedroom and bathroom counts correct on every site. What RMG puts in a listing is on the rental marketing page.
4. Condition and access. Make-ready finished before the listing went live; lockbox or same-day showings; the unit clean on the day it shows.
5. Terms. Pet policy, deposit at the AB 12 limit, lease length and move-in date all narrow or widen the pool.
6. Season. Late-autumn and holiday listings draw fewer movers; a review date set before listing decides when a small cut beats another week empty.
Two legal points before changing a price. For a new tenancy, Civil Code §1947.12(b) lets the owner set the rent, and neither the AB 1482 cap nor the emergency limit restricts a reduction; both govern increases.
An increase on a new asking rent is limited while an emergency declaration covering the county is in force. As of November 2, 2026, the Governor's October 15, 2026 Tropical Storm Rachel proclamation, which the Governor's Office of Emergency Services lists as applying Penal Code §396(b), (d), (e) and (f) in San Diego County through November 14, 2026 unless extended, limits new asking rents to 10% over the pre-declaration price.
The County's own September 30 proclamation set a 30-day period that ran to October 30; our November 2, 2026 check found no extension. Dates and the base-price rule are in the pricing guide.
Bottom line: the ZIP table tells you whether the market is slow or your listing is. In 39 of 73 ZIP codes, house listings average 30 days or less; past that, work the list, and price is the first item on it.
Methodology
Source. RentCast market statistics, one request per ZIP code, rental data type, retrieved October 27, 2026 through Realty Management Group's API account, the same pull behind average rent in San Diego by ZIP code. Per-ZIP reports have no public URL.
Definition. Days on market is RentCast's average days on the market of listed properties in the period, by ZIP, by bedroom and by property type. It is a listing-age measure that includes listings still active. The median is not used anywhere on this page.
Thresholds and aggregation. A ZIP is published when it had ten or more listings and October 2026 data (77 ZIP codes); it is ranked for houses when it had ten or more single-family listings (73). The 31-day house figure is the simple mean of those 73 ZIP averages, each ZIP counted once; the 32-day figure weights each ZIP by its house listings. Bedroom and property-type figures are listing-weighted across published ZIP codes; property types are included where a ZIP had five or more listings of that type.
RMG figure. Internal Rentvine management data, countywide, defined in the RMG section above. It is not comparable to the RentCast figure and is not presented as a benchmark against it.
Frequently Asked Questions About How Long San Diego Rentals Take to Lease
How long does it take to rent out a house in San Diego?
On the listing clock, houses in San Diego County had been on the market 31 days on average as of October 27, 2026, across 73 ZIP codes with ten or more single-family listings, each ZIP counted once; 32 days weighted by listings. 20 ZIP codes were at 20 days or under and 3 were over 60. The figure is RentCast's listing-age measure, which includes listings still active and does not confirm a signed lease.
Which part of San Diego rents a house fastest?
By average listing age, the shortest were Scripps Ranch (92131) at 10 days, then San Marcos (92069) at 11, Tierrasanta (92124) at 12, Del Cerro, Allied Gardens (92120) at 13 and La Mesa (91942) at 14, as of October 27, 2026. The short-age ZIP codes are inland and mid-priced, with house rents around $4,033 on average across the ten shortest. Listing age includes listings still active and is not the average time to find a tenant.
Which part of San Diego rents a house slowest?
By average listing age, the longest was Coronado (92118) at 127 days, far ahead of Del Mar (92014) at 64. The rest of the ten slowest are coastal or high-end ZIP codes, Point Loma and La Jolla among them, plus two thin samples in Eastlake 91914 and Bonita 91902. The ten longest-age ZIP codes averaged $4,960 in house rent against $4,033 for the ten shortest.
Do bigger houses take longer to rent?
Not by much, countywide. Weighted by listings, two-bedrooms averaged 31 days, three-bedrooms 32 and four-bedrooms 32, across all property types; one-bedrooms were the slowest category at 37. ZIP matters far more than bedroom count: three-bedroom listings ranged from 8 days in Mission Valley to 105 in Coronado.
Do apartments or houses rent faster in San Diego?
By listing age, countywide they are close: houses 32 days, townhouses 32, apartments 33, condos 37, weighted by listings. Inside a ZIP they can be far apart; National City apartments had been listed 86 days against 20 for houses. Check both figures for your ZIP in the ZIP hub before deciding which clock you are on.
What does days on market actually measure?
RentCast's average days on the market of listed properties: the clock starts when a listing goes live, the figure includes listings still active, and it stops when a listing comes down for any reason, which may or may not be a signed lease. It leaves out make-ready time before listing. A manager's days-to-lease figure, by contrast, starts at vacancy and ends at a signed lease. The two measure different spans and should not be compared as if they were one.
How fast does RMG lease a home?
Vacant RMG-managed homes leased in 13 days on average across more than 40 leases signed in the trailing 24 months ending August 2026, measured from vacancy date to signed lease date, countywide, per internal Rentvine records. Because that clock starts at vacancy and includes make-ready time, it is not directly comparable to RentCast's listing-age figure. City-level figures with unit counts are on the city guides.
My listing is past the ZIP average. What should I do?
Check the price against the bedroom row for your ZIP, not the all-unit average, then against the live listings. A listing with few showings and no applications past the ZIP's house average usually has a price problem, though condition, photos, access, terms and season can each do the same thing; the checklist above runs through them in order. Every vacant day costs rent times twelve divided by 365, about $111 at the countywide average. A reduction on a new tenancy is not restricted by the cap or the emergency limit, which govern increases; an increase is limited to 10% over the pre-declaration price while the emergency declaration covering the county is in force, through November 14, 2026 as of November 2, 2026.
Sources
- Market statistics by ZIP code. RentCast. Rental data type; bedroom and property-type breakdowns. Supports every days-on-market, listing-count and rent figure. Retrieved October 27, 2026 through RMG's API account; no public per-ZIP URL.
- Market Statistics reference. RentCast developer documentation. Field definitions. Supports the definition of days on market. Read October 27, 2026.
- Civil Code §1947.12. State of California. (b). Supports initial rent on a new tenancy. RMG record, verified Aug 20, 2026.
- Penal Code §396. State of California. (e), (j)(11). Supports the emergency 10% limit. Text read October 19, 2026.
- Price gouging: active proclamations. Governor's Office of Emergency Services. Tropical Storm Rachel entry. Supports the state emergency period through November 14, 2026. Read November 2, 2026; re-check before relying on a date.
- Most competitive rental markets, 2025 year-end. RentCafe. National time-to-lease. Supports the 41-day total-days-vacant benchmark. RMG record, Aug 2026.
- National rent report. Apartment List. National list-to-lease. Supports the about-30-day benchmark. RMG record, Aug 2026.
- RMG internal management data. Rentvine, countywide, trailing 24 months ending August 2026. Supports the 13-day figure and its definition. Not independently verifiable.
Your property, your number
You've seen every ZIP. Now let's run YOUR address.
A licensed broker prices your home against the live comparables in your ZIP and bedroom count and tells you the number, and the reasoning behind it. Whether or not you hire us.
Get My Property's Rental Price →Free. No obligation. Rated 4.9 stars across 127 Google reviews. Or call (619) 456-0000.
Realty Management Group · 4025 Camino Del Rio South, Suite 300, San Diego, CA 92108 · (619) 456-0000
About the author
Scott Engle is the Broker/Owner of Realty Management Group (DRE #01332676, Corp DRE #02075336). He has been a licensed California real estate broker since 2002, has managed San Diego County rental property since 2003, and founded Realty Management Group in 2005. As of August 2026, RMG manages 400+ units countywide, with management starting at a flat $199 per month, and holds a 4.9-star rating across 127 Google reviews. RMG has been named Best Property Management Company in San Diego by Expertise.com in 2023, 2024, and 2025.
Related Articles
- Average Rent in San Diego by ZIP Code: All 96 ZIPs, by Bedroom (October 2026)
- How to Price a Rental in San Diego: ZIP Data, Vacancy Math and the 2026 Rules
- San Diego Rent Cap 2026: The Limit Is 8.2%
- Should I Rent or Sell My San Diego Home?
- San Diego Property Management Cost: Flat Fee vs Percentage
Areas We Serve
San Diego · San Diego County · Chula Vista · El Cajon · Escondido · Poway · Carlsbad · Oceanside
This guide is general information for San Diego County rental owners, current as of November 2, 2026, and is not legal, tax or investment advice. Days-on-market figures are RentCast listing-age averages for the ZIP codes and date shown, cover the property types stated, include listings still active, and do not predict how long any property will take to lease. RMG figures are internal management data as defined above and are not comparable to the RentCast figures. Emergency price limits run by declaration and can be extended; confirm what is in force before you set or advertise a rent. Consult a qualified attorney on your own facts.